DA Insights
Color by Type
DA Insights
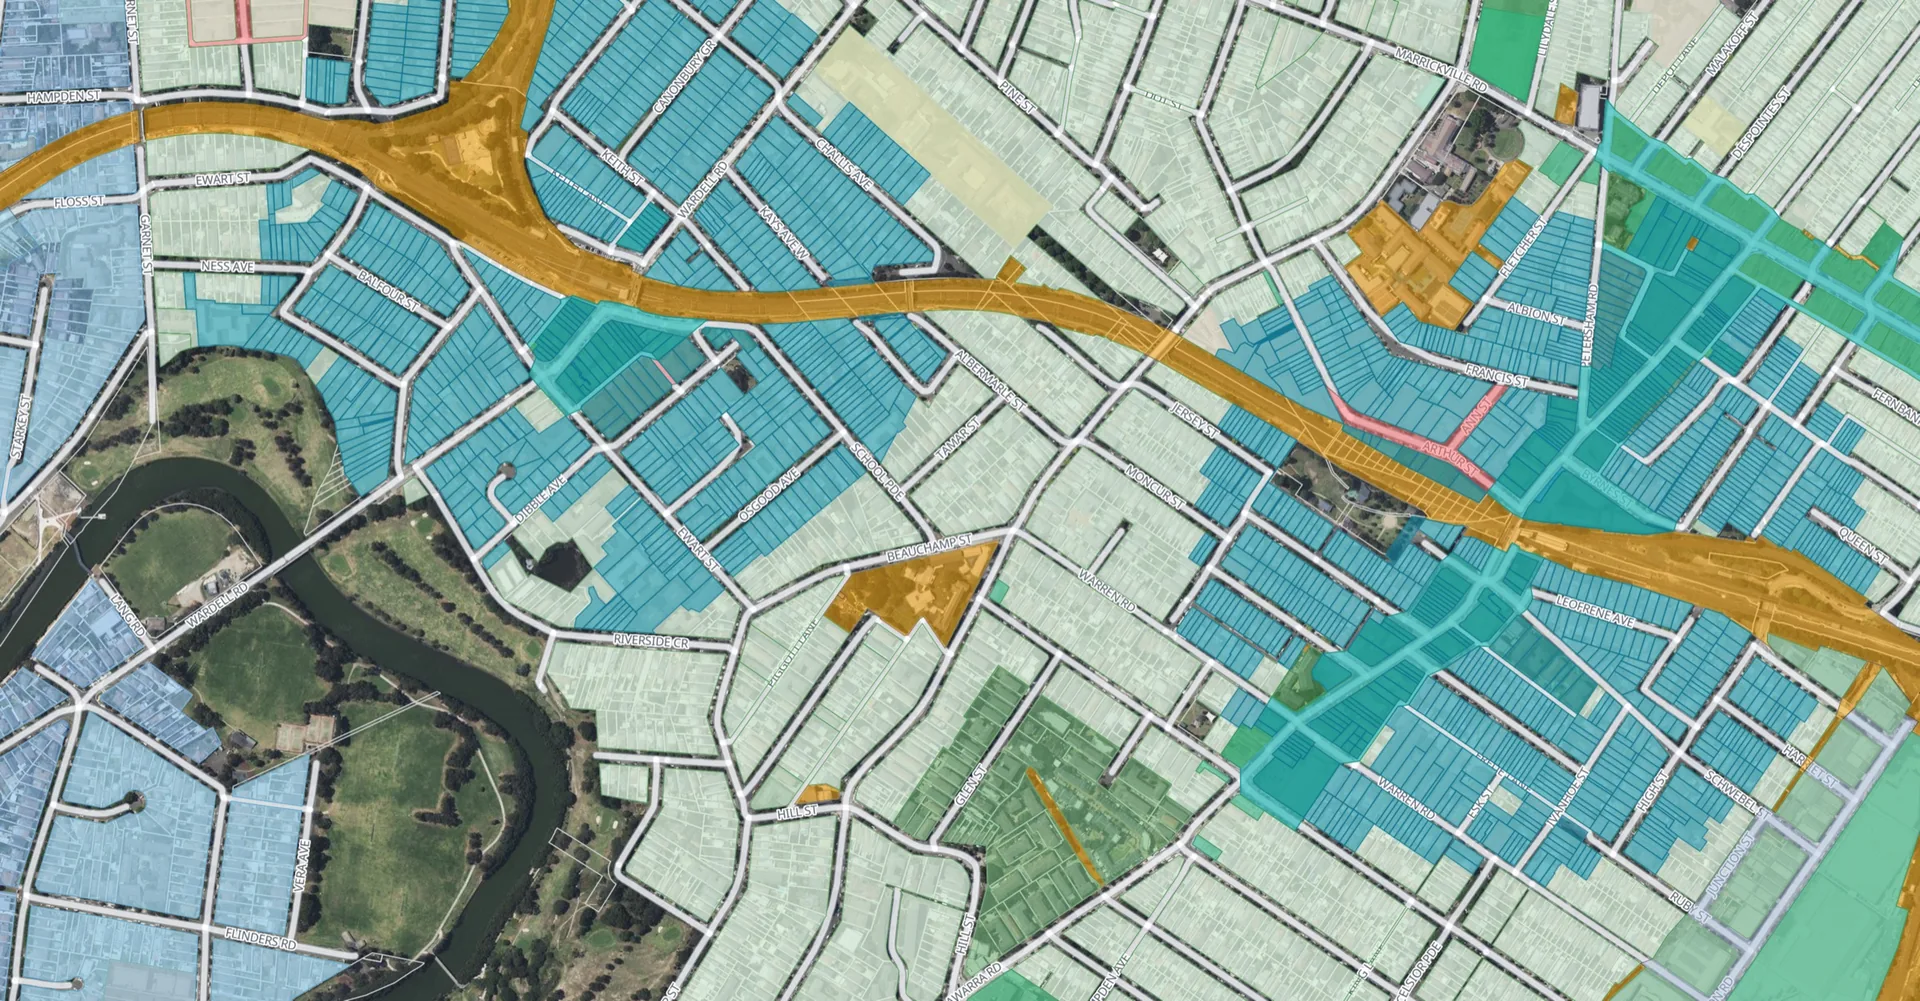
Understand what's being built, what it costs, and how fast it gets approved — for any area on the map. DA Insights gives you viewport-scoped analytics that update as you pan and zoom: development type breakdowns, average costs by category, approval rates, and processing times. Color-coded map markers let you see the spatial distribution of different development types at a glance. Whether you're assessing a suburb's development activity, benchmarking costs, or building evidence for a DA proposal, Insights turns raw application data into actionable intelligence.
What DA Insights includes
Development type breakdown
See what's being built in any area. Horizontal bar charts show DA counts by category — new dwellings, apartments, secondary dwellings, alterations, commercial, and more.
Cost analytics
Average cost of development by type, ranked and color-coded. Understand how much each category of work costs in your target area.
Color-coded map markers
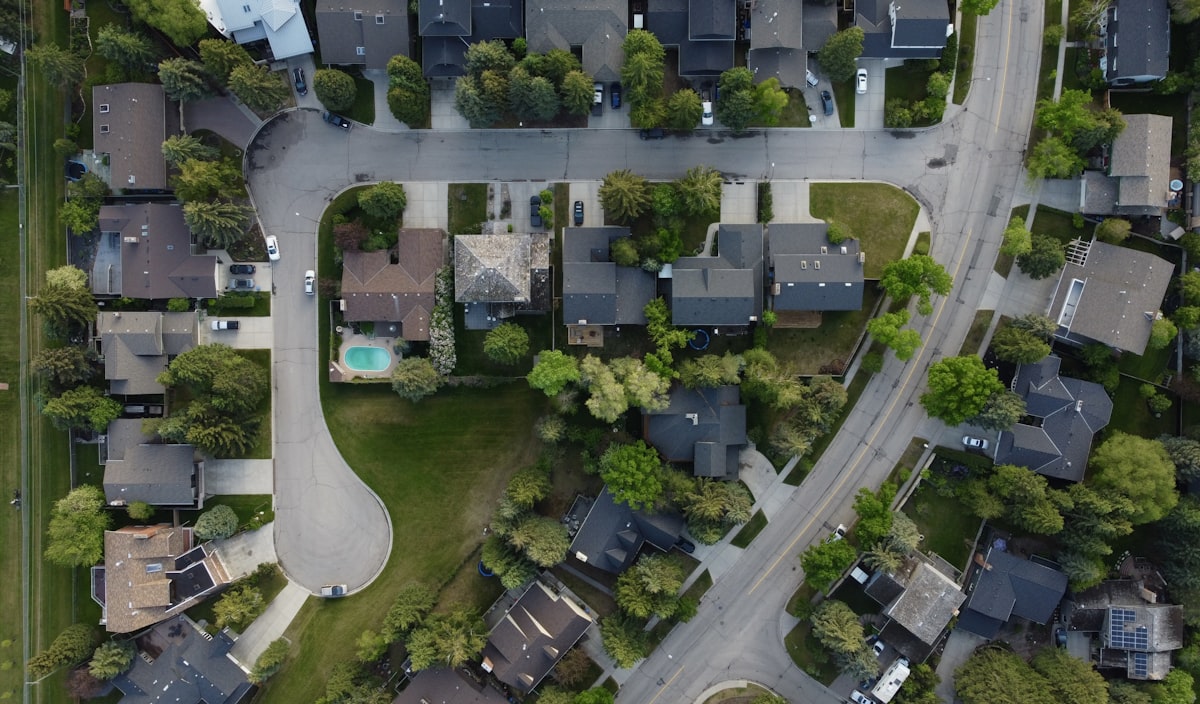
Switch DA dots from outcome-based coloring to building-type colors. Instantly see the spatial distribution of houses, apartments, subdivisions, and commercial projects.
Processing times & approval rates
Summary cards show total DAs, overall approval rate, and average assessment days for the current viewport. Compare areas at a glance.
Viewport-scoped analytics
Pan and zoom to any area — the analytics panel updates automatically. No need to select a suburb or council; the data follows your map view.
Time-range filtering
Adjust the lookback window from 6 months to 5 years. See how development patterns have shifted over time in any location.
DA Insights
Development Type Share
Avg Cost of Development
See development activity in any area
Open the map, enable DA Insights, and explore development patterns across NSW.